
On 28 July 2016 at 00:53, liubowen (A) liubowen2@huawei.com wrote:
Hi,
Thanks for your time!
I am bob. I am interested in the CoreSight Project. And I get much from the web page http://www.linaro.org/blog/core-dump/coresight-perf-and-the-opencsd-library/ .
Because I work on ARM64, there is a bug with perf working on ARM. Specific information from https://www.linaro.org/blog/core-dump/debugging-arm-kernels-using-nmifiq/.
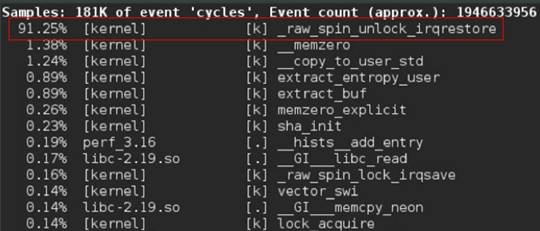
For instance, when we run : dd if=/dev/urandom of=/dev/null, over 90% of the CPU time is spent unlocking interrupts and the cryptographic operations that should dominate the
use case are completely hidden.
The author Daniel Thompson from Linaro comes up with a primary solution, however he suggests it will need further work.
Now, CoreSight can trace program flow only by hardware. If we combine coresight with perf, when we run “dd if=/dev/urandom of=/dev/null” and perf record, will the report be normal?
If it is normal, it will be amazing!!! And, I am eager for the related information.
What do you expect to see in a "normal" report?
There is no restriction on the code CoreSight can trace, and with the soon-to-be released address filtering capabilities, knowing exactly what the HW is doing will become a lot easier. The only requirement (for now) is that CPUidle be disabled.
I have followed the documentation to enable coresight and perf, but get stuck. I can not figure out whether it is normal.
That is unfortunately the downside to CoreSight. But as every powerful technology, complexity is inherent.
I greatly appreciate for your help!!! Thanks again for your time!!!
I am not sure of how I can help you here. Other than the one above (to which I have replied), I don't see any specific questions.
Regards, Mathieu
CoreSight mailing list CoreSight@lists.linaro.org https://lists.linaro.org/mailman/listinfo/coresight